Know where the water is standing before the season turns.

A seasonal habitat map of standing water and irrigation ponding, built from multispectral satellite imagery, so you can check which wards to put in front of your larviciding and spray teams first.

GSD
0.5–2 m (High)
Cadence
Seasonal
Platform
High-res satellite
Spectral
Multispectral, no thermal band
Line sketch of a pond with reeds, a rain cloud and a season dial
Field sketch: a pond edge in the reeds, rain coming in, and the season dial turning towards the rains. A schematic drawing only.

No. 01 · The job today

Last season's list

Many programmes plan the next round from the last one. The breeding sites on the list come from earlier larval surveys, from the entomologist's sentinel sites and from what the district officers know about their own wards. That is real knowledge, and it is also a season old. The rains do not fill the same ground twice. A new irrigation scheme, a borrow pit left open after road works, a canal that now leaks into a field: none of them is on the list, because nobody has walked there yet.

So the teams go where they went before. The listed sites get larvicided again, and the water that formed this year in a ward nobody checked stays untreated until someone reports a rise in cases. By then the round is routed and the budget is committed. The programme officer knows the list has gaps and has no quick way to say which wards hold them.
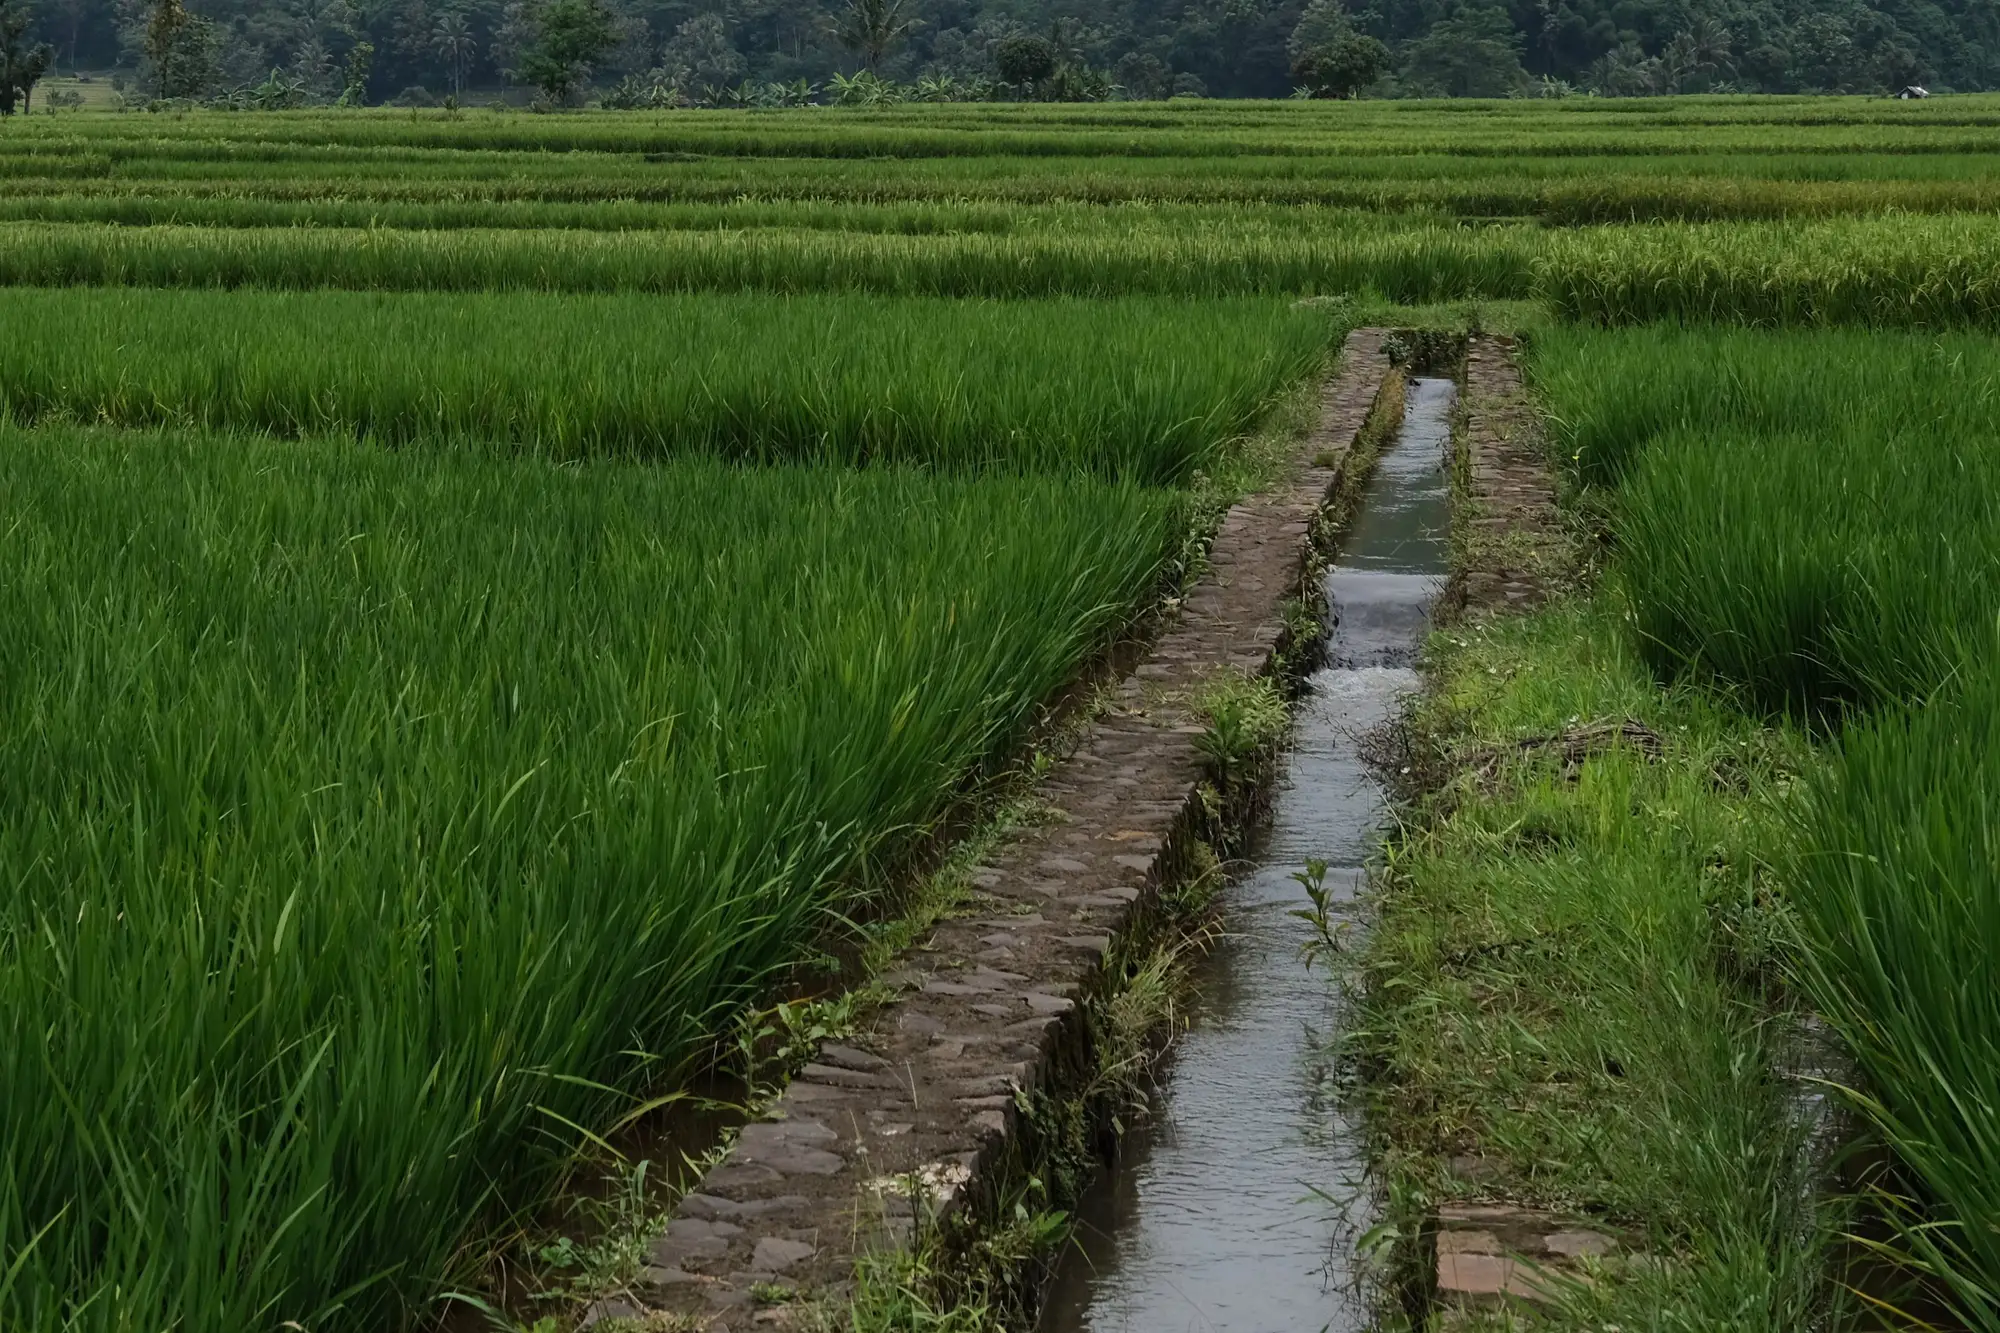
A narrow irrigation channel running between flooded rice paddies under a cloudy sky
An irrigation channel between rice paddies. Ground like this holds water one season and not the next.

A map of where water is standing, timed to the start of the season, leaves the survey work with your people. It tells the survey team where to look first, and it puts the wards nobody visited beside the ones everybody knows.

No. 02 · What you get

What comes back for each season

  1. 2.1Habitat-suitability layer

    GeoPackage or shapefile

    Standing water and irrigation ponding zones across your programme area, with vegetation condition alongside, scored for how well they suit breeding. It opens in QGIS or ArcGIS on top of your ward, district or catchment boundaries. One layer per season, delivered ahead of spray planning.

  2. 2.2Seasonal change note

    PDF

    A short note on what shifted in water and vegetation since the previous pass: ground that is newly wet, ground that has dried, areas where the score moved. The first season has nothing to compare against, so the note starts from the second.

  3. 2.3Field routing extract

    Printable list and map sheet

    Wards or catchments ordered by how much suitable habitat the map found, so the team leader can walk through the priority order at the planning meeting and hand teams a printed sheet. Your own people still build the routes from that order.

No. 03

How it works

  1. Define your programme area

    Send the ward, district or catchment boundaries you plan by, in the layer your ministry already uses.

  2. Season-timed imagery

    We pull a multispectral pass over that area timed to the onset of the season, from a high-resolution satellite at 0.5 to 2 m.

  3. Segment and score

    Standing water, ponding and vegetation condition are mapped across the area, then scored for how well they suit breeding.

  4. Layer delivered

    The habitat layer, change note and routing extract come back ahead of spray-round planning. We go through the top of the priority order with your team on a call.

No. 04 · Where it fits in your workflow

Between surveillance and the spray round

The layer sits after entomological surveillance and before spray-round planning. Your entomologist keeps the larval surveys and sentinel sites. The map tells the programme which wards or catchments to put first and where the site list has gaps. Teams sent to a flagged area still confirm what is there on the ground before anything is treated, and what to treat and how stays with the programme.

If a ward scores high and has no site on last season's list, that is where a survey team goes before the round is routed.

No. 05

Limits

  1. 01Field scale, ward scale

    At 0.5 to 2 m a pixel is large against a discarded tyre, a gutter, a water tank or a flower pot. The map finds ponds, paddies, ponded fields and open pools big enough to show up as water. Household containers are out of reach. At the coarser end of the range, small pools do not resolve at all.

  2. 02Cloud in the rainy season

    Optical imagery needs a clear view of the ground, and the rains are when cloud is thickest. A pass over some wards can be delayed or come back with gaps. Gaps are marked on the layer and left unfilled.

  3. 03One pass per season

    Cadence is seasonal, timed to onset. Water that forms after the pass, or dries before it, is missing from that season's layer. What happens through the weeks that follow is outside what one pass shows.

  4. 04Habitat only

    The score describes conditions that suit breeding. Mosquito density in a ward and the number of malaria or dengue cases are outside what it says.

  5. 05Multispectral only

    The satellite has no thermal band, so there is no water-temperature reading. Water and vegetation come from visible and near-infrared bands.

  6. 06Not a survey

    It cannot tell you which species is breeding in a site, whether larvae are present or whether a site needs treating. Those answers come from your own sampling.

No. 06

Who it's for

For

  • Malaria and vector control programme officers planning larviciding and spray rounds for a ministry or district health office.
  • Programme entomologists who want a seasonal list of places the sentinel sites do not cover.
  • Teams that plan by ward, district or catchment and work in a GIS.

Not for

  • Household container surveys or door-to-door inspection.
  • Teams who need weekly or real-time water tracking.
  • Teams looking for case-count forecasts or an outbreak early warning.
  • Teams hoping to drop larval sampling.

No. 07 · FAQ

Questions before a project

Can this replace our larval surveys?

No. It shows where water is standing so the survey team can decide where to go first. What lives in the water is still your survey's job.

What happens in the rainy season when it is cloudy?

Cloud can delay the pass over some areas or leave gaps in the layer. Gaps are marked so you can see which wards need another look.

How often is the layer updated?

Once a season, timed to the start of the transmission season. There are no weekly updates.

What does 0.5 to 2 m resolution miss?

Small containers such as tyres, gutters, tanks and pots. It finds ponds, paddies and ponded fields at field and ward scale, and the smallest pools may not show up at all.

Does it predict case numbers?

No. It maps conditions that suit breeding. It makes no forecast of mosquitoes or cases in any ward.

How do we check it against our own sites?

Pick a district where your team has recent larval survey records and keep them back. When the layer arrives, lay your known sites over it and see how many fall inside the flagged areas, and what the map flags that your list does not.

Will it open in our GIS?

The habitat layer comes as a GeoPackage or shapefile that QGIS and ArcGIS read, with a PDF note and a printable routing sheet. We do not write into your systems.

Who owns the imagery and the results?

Licence and ownership terms for the layer and the imagery behind it go into the project agreement before anything is ordered. If your legal unit needs to see them, ask early.

How is a project bought and priced?

Price depends on the size of the programme area and the imagery used, and we scope it for your area. Tell us how your ministry buys these services and we will fit the project to that process.

Plan next season's routes with the map in hand.

Tell us your programme area and when spray-round planning starts. We will tell you straight whether the imagery calendar can meet it.

Start a project