7 October 2026
How to prioritize larviciding routes when you've got three crews and forty sites
Every programme officer hits the same wall in May or June: the site list is long, the crews are not. Three trucks, maybe four if a seasonal hire finally clears onboarding, and a county full of catch basins, irrigation tailwater, tire piles and roadside ditches that all looked wet on last week's drive-by. You can't treat everything on a weekly cycle. What matters is which of these sites, treated this week, moves the density numbers.
Here's a way to get there without burning a planning day you don't have.
Rank by production potential, not by memory
Most districts default to the list from last season, the same twelve sites that always come up at the Monday briefing. That list is useful but it's backward-looking. A catch basin that produced Culex broods every July for three years might be bone dry this year because the storm line got re-graded. Meanwhile a new retention pond behind last year's subdivision build-out is sitting full and nobody's dipped it yet.
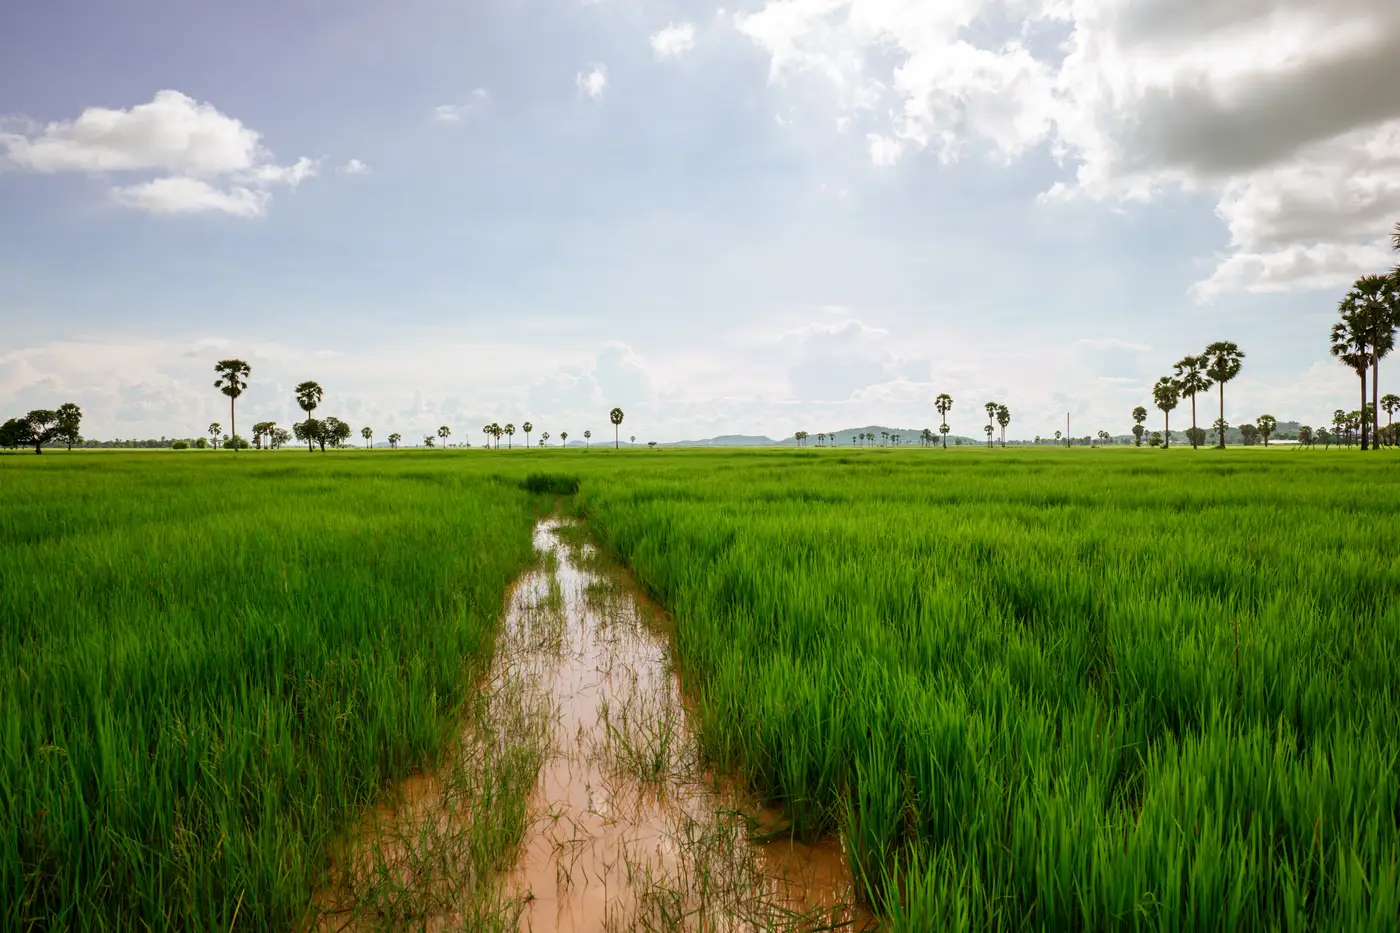
Start from what's wet and vegetated right now, not from history. Standing water alone doesn't tell you much. Standing water with emergent vegetation, slow flow and a few days of residence time is a different animal, that's where egg rafts and instars actually accumulate. If you can get a seasonal read on which parcels fit that pattern before you send a crew to confirm with a dipper, you've already cut your reconnaissance time in half.
Score each site on three things your crew chief already tracks informally: how long the water persists after a dry spell, how much floating or emergent vegetation has grown in it, and how close it sits to the service-request cluster. A site that scores high on all three jumps the queue even if it's never been treated before.
Build the route around drive time, not site count
Once you've got a ranked list, the second mistake is routing by geography alone, closest-first, with no regard for treatment windows. Bti and most IGRs have a residual window, typically a week to ten days depending on product and water temperature. If your route takes nine days to loop back to site one, you're not maintaining control there, you're re-treating a site that already re-populated.
Split the ranked list into tiers that match your actual crew capacity. If one crew can hit twelve sites in a day covering forty minutes of drive time between stops, your top tier is exactly those twelve highest-ranked sites that fit the loop. Lower-tier sites get folded into a secondary loop that runs on a longer cycle, maybe once every ten to fourteen days, with the understanding that you're accepting some breakthrough there in exchange for holding the line on the high producers.
Weather throws this off constantly. A storm that refills ditches across the whole service area moves your tier-two sites up the queue for a week, and your tier-one sites need an off-cycle pass if they got flushed and refilled. Build slack into the schedule for that, don't treat the route as fixed once it's printed.
Where the pre-season read fits in
The hardest part of this whole exercise is doing it before the first service calls come in, when you're still setting up the season's spray calendar and don't yet have a field crew's worth of dip counts to work from. That's the gap a seasonal habitat-suitability layer is built to close: a read on standing water, irrigation ponding and vegetation conditions across the whole service area, built from satellite imagery before transmission season starts, so your tier-one list isn't just last year's twelve sites with a new date stamped on it. Breeding Habitat Map turns that pre-season picture into the same kind of ranked layer you'd build from a windshield survey, minus the weeks it takes to drive every parcel first.
If your crews are stretched thin this season, it's worth seeing what that layer looks like for your own service area before the first batch of complaint calls comes in.