7 October 2026
NDWI vs NDVI: which index actually flags standing water before season?
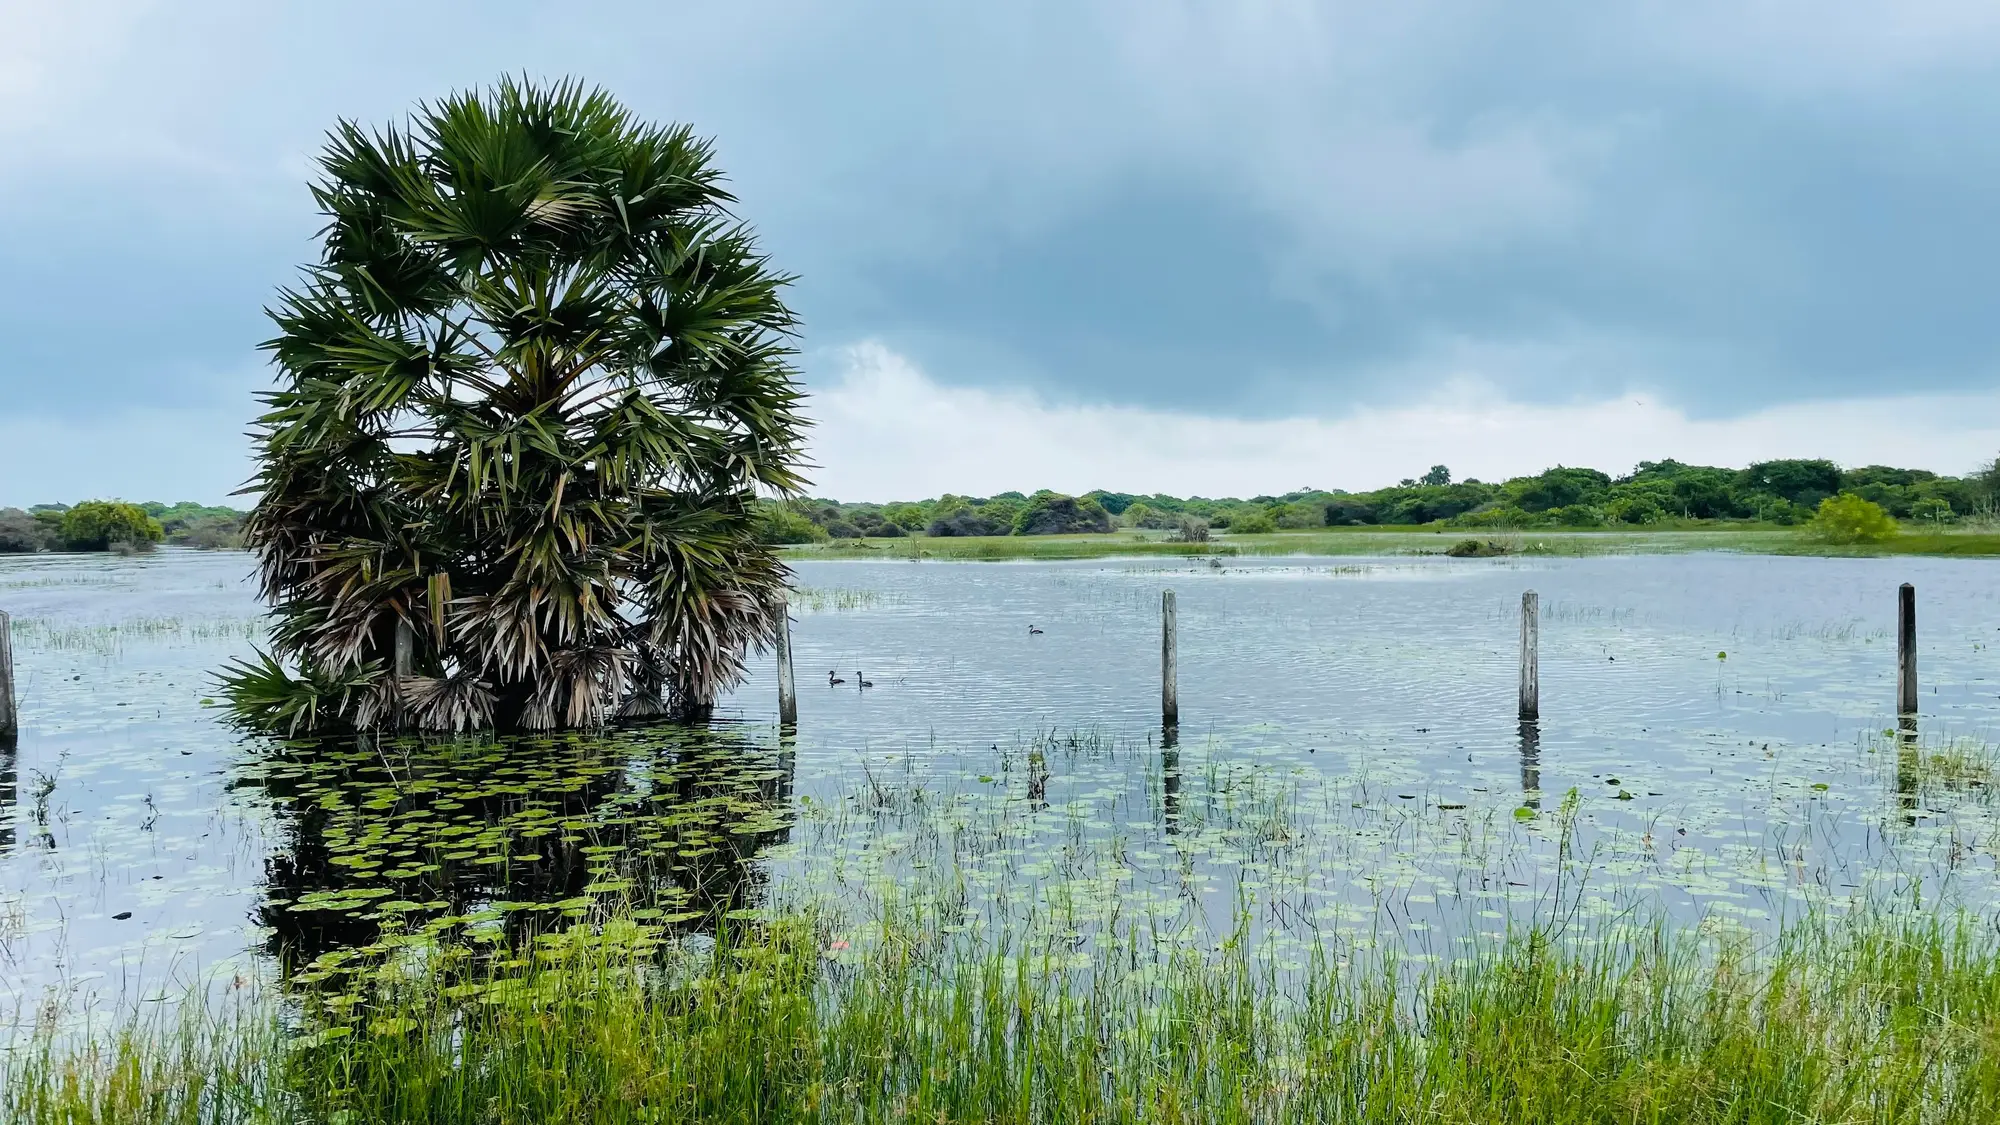
If you've pulled imagery for your district before and tried to eyeball breeding sites off a vegetation index, you've probably already hit the problem this post is about: NDVI and NDWI are not interchangeable, and using the wrong one for the wrong terrain is how a program ends up spraying a dry field while a flooded one sits untouched three kilometers over.
Both are band-math formulas run on multispectral satellite imagery. Both get thrown around loosely in GIS trainings as "water detection." They're not measuring the same thing, and for larval source management the difference matters more than it does for, say, crop monitoring.
What NDWI picks up
NDWI (the McFeeters version, green minus near-infrared over green plus near-infrared) is built to separate open water from everything else. Water absorbs strongly in the near-infrared band and reflects in green, so the index pushes open water pixels toward high positive values while soil, pavement, and dry vegetation drop toward zero or negative.
This is the index you want for rice paddies holding water, borrow pits, blocked drains, and the open ponding that shows up after a storm sits on flat ground for a few days. Where it struggles is anything with a canopy over it. Floodwater under rice tillering, water pooled beneath mangrove or dense scrub, irrigation ponding hidden under crop cover: NDWI often misses these because the sensor is seeing leaf, not water.
What NDVI tells you instead
NDVI (red and near-infrared) measures vegetation vigor, not water directly. A sudden green-up in a floodplain, an irrigation command area, or a field edge that's normally scrubby and brown is frequently a proxy for recent water, because that's usually what triggers the flush of growth. This is the mechanism behind a lot of "satellite finds mosquito breeding sites" claims you'll see in trade write-ups: it's not that NDVI sees water, it's that unusually high or rapidly changing NDVI in a spot that's normally dry is a decent tip-off that water got there recently.
The catch is that NDVI can't tell you why vegetation greened up. Irrigation, rainfall, a fertilizer application, a crop rotation change: all of these move the index the same direction. On its own, NDVI gives you candidate sites, not confirmed ones.
Why this matters for routing teams before the season turns
A program that runs NDWI alone will catch open ponding and miss anything vegetated. A program that runs NDVI alone will flag a lot of ground that turns out to be an irrigated field with no standing water at all, which burns crew time and credibility with the farmers whose plots you're walking through. The useful read comes from running both over the same area and looking at where they agree and where they diverge: open-water NDWI hits are your highest-confidence spray and larvicide targets, while NDVI anomalies in spots with no NDWI signal are where you'd want a field team to ground-truth before committing resources, since that's exactly the under-canopy ponding or irrigation seepage that one index alone would hide.
Neither index carries a thermal signature, so this method won't catch subsurface moisture or water hidden under full crop cover the way a thermal sensor might. What it does give you, run at a seasonal cadence ahead of transmission season, is a habitat-suitability picture built from both the open water and the vegetation response to it, which is a meaningfully different starting point than working off last year's breeding-site list and this year's rainfall totals.
That's the layer we build at Breeding Habitat Map: a pre-season read on standing water, irrigation ponding, and vegetation conditions pulled from multispectral imagery, meant to route spray and larviciding crews to where density is going to rise.
If your district is still planning routes off last season's site list, it's worth seeing what the current season's water and vegetation conditions look like before crews go out.