7 October 2026
Satellite imagery vs ground larval surveys: where each method earns its keep
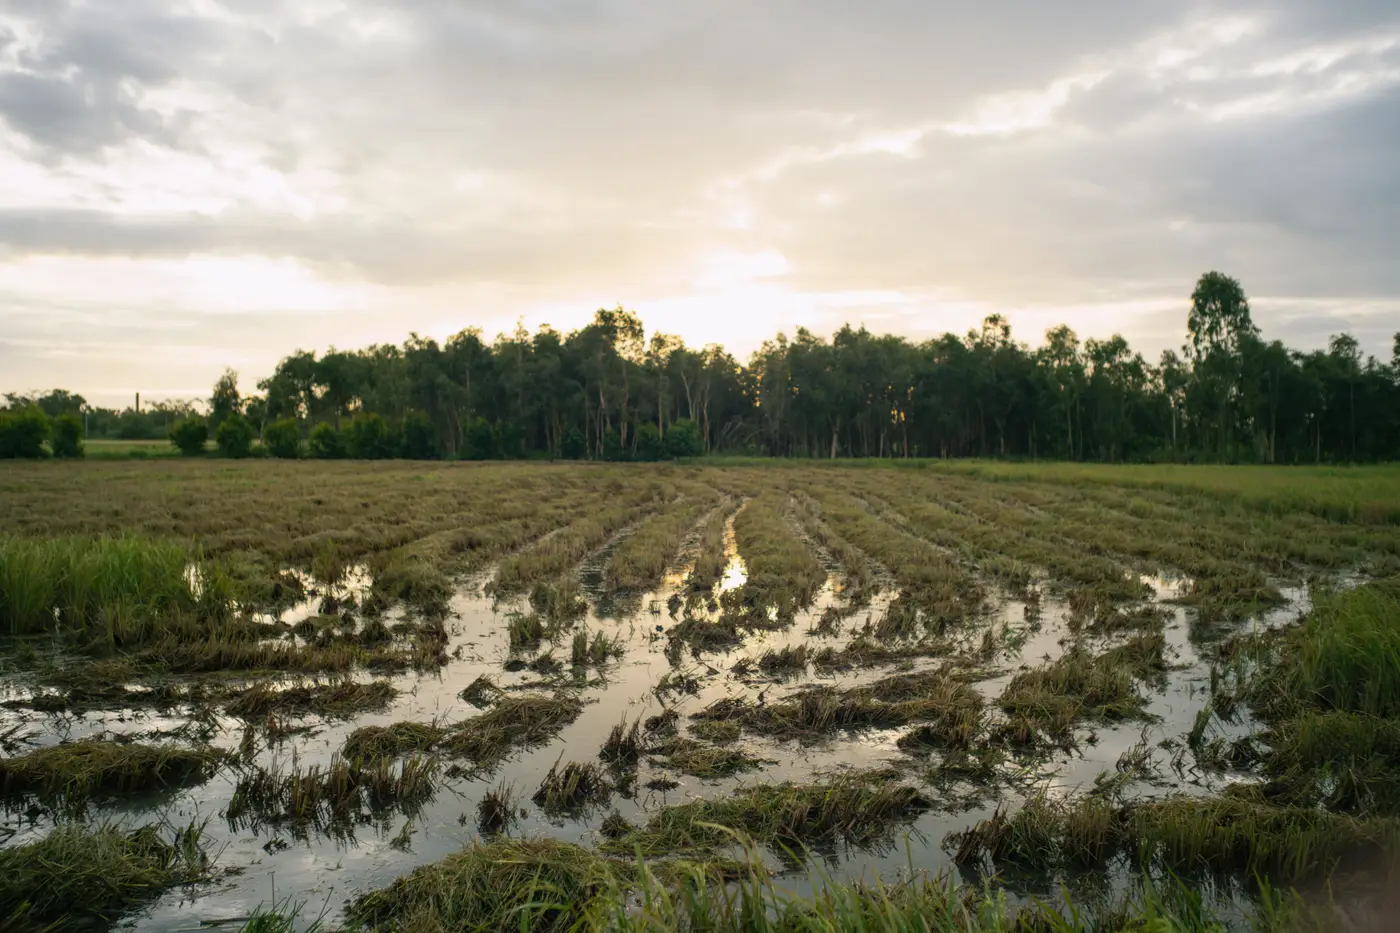
A programme officer running a season of larval-source management needs two different kinds of information at once: where water is sitting across the whole district, and which specific containers and pools are producing larvae right now. Satellite imagery answers the first. A dipper with a cup answers the second. Neither one covers for the other.
What ground larval surveys catch
A dipper walking a grid, scooping containers and ditches, counting instars, is still the only way to confirm a site is actively producing. Larval indices, container index, house index, breteau index, come from standing in the water, not looking at it from above. No satellite tells you whether a discarded tire is holding three larvae or three hundred, or whether the residents next door have started covering their drums since last visit.
The limits show up fast once you scale past a few blocks. A crew can cover maybe a few dozen sites a day on foot, less in dense peri-urban blocks or where access means knocking on doors that don't open. Irrigation canals on the edge of town, seasonal floodplain pools, abandoned construction sites behind locked gates: these get missed not because surveyors are careless but because nobody told them to look there. Last season's breeding map, redrawn from memory and old field notebooks, tends to send crews back to the same known sites while new ponding goes unchecked until someone calls in a complaint.
What satellite imagery catches
Multispectral imagery reads what the water and the vegetation around it are doing, and that turns out to be a lot. Standing water has a distinct spectral signature even under partial canopy. Irrigation ponding shows up as moisture accumulation in fields days or weeks before anyone walks the area. Vegetation stress or greening near a floodplain edge can flag where runoff is collecting before the puddle is visible from the road.
At 0.5 to 2 metre resolution, that's enough to pick out a cluster of containers in a scrapyard or a waterlogged depression behind a row of houses. It isn't fine enough to see an individual larva, and that was never the job. The imagery runs on a seasonal cadence, refreshed before each transmission season turns, so the picture a programme officer works from reflects this year's rainfall and this year's irrigation schedule rather than whatever got mapped two years back. There's no thermal band in the mix, so it won't pick up body heat or fine temperature gradients. It reads light reflectance across the visible and near-infrared range, the part of the spectrum water and plant moisture change most.
Where the two methods disagree, and why that's useful
Imagery narrows a whole district down to the patches worth walking: the irrigated plots, the low-lying ponding, the vegetation signatures that match past breeding conditions. Ground teams then confirm with a dip, log the species and instar stage, and treat what's producing. Skip the imagery and crews keep covering the same familiar ground while new sites go unflagged. Skip the ground visit and you're treating standing water that might be bone dry of larvae, or missing the tire pile tucked under a tarp that no spectral band will ever see.
Neither replaces the other's job. A dipper confirms presence. Imagery narrows down where to send that dipper before the season gets ahead of the roster.
For a programme sitting down before the season starts to plan where larviciding and spray crews go first, Breeding Habitat Map turns that seasonal imagery into a habitat-suitability layer built to route crews, not just illustrate a report. If your team is still routing from last season's notebook, it might be worth seeing what this season's water looks like first.